For decades business process mapping (BPM) has been the starting point for analyzing work processes. Total Quality Management, Lean Manufacturing, Six Sigma, and Business Process Re-engineering are all methods of work management that have the “Business Process” as their point of reference – and centre of attention – for business improvement.
When we try to break down the “Business Process” term we realize that its usage stretches far beyond the mechanical workflow processes, ideally pointed out by BPM techniques. For example: are the subtle negotiations between a seller and a customer adequately represented in a process map? What about the relationship between a social worker and client, or its network of reference? And what about the network that inspired the sale of Apple’s entertainment products? The understanding of a university professor’s lesson? The treatment from an expert doctor?
We can of course describe the above operations in terms of business processes, but in order to improve such processes we need to go beyond traditional mapping and analysis methods.
Stabell and Fieldstad in their pioneering work on “Value Chains” identified how business value can be generated through methods other than those of traditional simple process analysis. They also introduced the concept of “Value Shops” to satisfy the business processes driven by experts, such as medical centres, law firms, consultancy companies or research institutions, and “Value Networks” for businesses that thrived on client interdependence, as in the case of telecommunications, banks and entertainment businesses. All of these alternative business models have traditional process chain activities, but in no way do these activities represent the key process. Subjecting these models to traditional analysis techniques essentially means improperly using available resources, thus running the risk of not achieving satisfying results.
So if your business is not centred on Value Chains, what are the alternatives? Two mature approaches are used to analyse businesses related to Value Shops and Value Networks: Social Network Analysis (SNA) and Value Network Analysis (VNA).

SNA is able to identify the people within your organisation that others depend on in terms of work processes, information and support. In this sense SNA does not mean a method that simply covers technical expertise. In fact, in our experience, SNA has often uncovered matters related to organisational expertise, i.e. to those competencies that answer the questions: “how can we make sure that things work around here?” or “how can we make sure that the procurement system works for us?”, which also help to understand the relationship channels between your experts inside the business and the rest of the organisation. This is similar to a BPM for the more mechanical processes and offers the same level of analysis and benefits.
SNA can provide information both on Value Shops and on models based on Value Networks. VNA can underline – from its perspective – Value Networks and Value Chains by pointing out the client interdependencies and shaping the tangible and intangible flows that connect the different “roles” within the organisational network. SNA works, therefore, at the personal level and VNA works at the role level.
There is a gap between the two analyses that allows us to observe how organizational roles interact at the more personal level than at the work process level. We call this analysis gap Organisational Network Analysis (ONA), which simplistically can be traced back to an SNA with the “roles” as the network nodes, instead of the individuals. It differs from VNA because the connections between roles are not detailed and explicit like value flows, but simply identified by their degree of inter-role dependency. ONA can be complementary to both SNA and VNA and can address, in different ways, all three value configurations (figure 1).
In this document we will introduce the concept of ONA and illustrate it in detail with a case study.
Where would ONA be used?
Over the years we have conducted numerous SNA and VNA activities. These investigations were not only limited to Value Shops or Value Network businesses but also to Value Chains. Inevitably there are elements of both techniques that can limit the choice of adopting them. For SNA, for example, reluctance is typically connected with privacy issues and the presence (or non-presence) of some people within the social network map emerging from the concluded analysis may be observed as “uncomfortable”. All of this can be mediated by avoiding showing the names of people on the map, but we must not forget that an SNA in fact asks people to mention individuals by name. For VNA privacy is not a problem as the unit of analysis always refers to the “role”. Tangible value flows within the map created with VNA are familiar to those practised in traditional analysis techniques. Intangible value flows are instead often related to people – or centred on relationships – which can be perceived as “foreign” by VNA participants and can take some time to practise before they are acquired. As in BPM, the entire mapping process can be time consuming as each individual role is analysed for the contents of its value flows. All of this can often limit the level of organisational analysis that can be achieved.

By considering ONA as a meeting point between SNA and VNA, it is possible to achieve the benefits of both approaches while avoiding many of the limitations.
ONA is essentially an SNA conducted at the role level. Participants are asked to nominate “roles” rather than “people” they depend on for performing their job correctly and well, together with the degree of dependence they can have on certain roles. In this case, the privacy issues that emerge with SNA are therefore avoided (or at least they are for roles that have more than one occupant!). It is also much simpler (especially compared to VNA) for participants in the analyses to indicate the roles they depend on and refer to for their work processes.
The real positive side of ONA is that it could be much easier for organisations to adopt, given that it does not require the long analysis and processing time of VNA and it does not interfere with privacy and personal issues of employees, thus avoiding becoming an “uncomfortable” and expensive procedure.

We therefore deem that ONA is best placed to be adopted by organisations intending on doing a quick and broad organisational analysis that goes beyond sim
ple business processes.
It will typically be Value Shops and Value Networks that will be able to benefit the most from ONA, although Value Chains could also be positively influenced by it. ONA can highlight these aspects in a much faster and more efficient manner than analysis processes such as BPM and VNA.
ONA Case Study
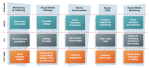
The best way to illustrate how ONA works, along with its actual benefits, is through a case study (figure 2). For our case we have chosen a large financial organisation with over 120,000 employees. The project was focused on the Information Technology Services department of over 4,000 people. Problems related to privacy and the protection of employees prevented the department from adopting a traditional SNA. The classic procedure was therefore adapted to ensure that people could nominate “roles” (and no longer nominate “individuals”) that they depend on to efficiently and effectively carry out their own work. The roles were therefore analysed at multiple levels by observing, on the company’s organisation chart, the links connecting them directly. At the top level 8 service line roles reported directly to the CIO. At the second level there were 44 business units, below which were 200 activity roles. All of these roles were well documented within the department and each service was detailed in an operations manual.
The work process. As could easily be envisaged, by a top-down management organisation, the department has performed a considerable job over the years of identifying the roles and breaking them down precisely into responsibilities and tasks. However, what were not taken into consideration were the (informal) peer-to-peer exchanges within the business. One of the main objectives of the ONA was in fact to highlight these peer-to-peer exchanges within the company.
The questionnaire. The initial study collected results only at the management levels (for a total of around 200 officers), with the intention of broadening the research at a later stage. The survey was structured so as to present activities belonging to the business units, which in turn depended on service lines, and the organisation was therefore described in classical hierarchical terms. Respondents could, however, nominate any other role – including from other areas – that they interacted with in the performance of their work, and they also had the possibility to indicate the degree of important of that interaction. The questions on interactions concerned:
- Daily operations (day by day);
- Problem solving support;
- Information sharing;
- Desire for more contact.
As the organisation was described in hierarchical terms, a report of a connection between two activities could infer a connection also between a business unit and service lines, thus facilitating analysis at different levels. In practice, however, the limited sample of 200 respondents meant that the analyses at the activity level were less significant and made it clear that a larger sample would be required.

Mapping and Analysis. The ONA results have shown data on relationships among roles and on their dependency and the strength of the links. At the highest level, the relationships are defined as a “critical dependency” of one role on another. Such links can be reciprocated, indicating a bilateral dependency of two nodes of the network (i.e. when one depends on the other and vice versa).
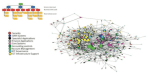
Figure 3 on the previous page shows the dependency links between the role activities for the daily operation relationships. The nodes represent a role activity, coloured based on the service to which they belong. The size of the node reflects the number of “mentions” received (in-degrees), underlining the importance of the node: the more a node is requested the larger it is on the map. In this case the map only shows the critical dependencies.
What is immediately noticeable is the difference between the mapping produced by the ONA and the organisation diagram typical of process mapping. As we can see the map is not at all structured and shows a lot more connections than those highlighted by the organisation chart. While we can see some areas grouped together, we can notice that the connections between service lines are not as structured as they would seem. So the question is: which is closer to reality: the organisation chart, the business process map or the ONA?
Business process mapping, when used for functional improvement, is intended to represent the performance of working processes. The analysis of the “as-is” situation is then aimed at providing the opportunity to design strategies from which the “as-is” processes can be adapted or even removed in order to improve the organisation’s performance.
But what happens when the “as-is” representation is only a false reflection of what is really happening? In an organisation based on the Value Shop style a Business Process Map could effectively show, as we have said, a patient’s stay in a medical centre, but it is very unlikely that it would be able to show the critical dependencies between roles in the centre relating to information, experience or knowledge flows existing in the organisation. In an organisation based on the Value Network style, BPM would only be able to identify linear flows, inevitably missing all the critical feedback or connections that exist in reality. Even the most sophisticated business processing tools are used to collect feedback and to facilitate the modelling of processes, and we can verify the possibility of collecting these data with classic techniques, soon realising the level of complexity that the analysis would require.
So what innovative techniques would an ONA offer? The final objective of an ONA is no different than the objective experimented with a BPM: the search for interventions that are able to improve working flows within the business and lower costs by increasing the quality of products or services offered. The analysis techniques and the related methods differentiating the two approaches are shown in the following table:
| BPM Analysis Techniques | ONA Techniques |
| Mapping of transactional flows | Mapping of dependence between network nodes |
| Starts with “stock and flows” | Starts with relationships among people |
| Looks for inefficient flows | Looks for complex interactions and interdependencies |
| Analyses capacity and use | Analyses capability and involvement |
| Optimisation has a mathematical interpretation | Optimisation has a behavioural interpretation |
As the table shows, ONA is an approach much more centred on people than BPM. The success of this type of analysis is enhanced for all organisations that are focused on relationships among people and on the supply of services, such as the medical, legal, financial, educational or social work sectors, which, as we know, nowadays dominate the most advanced economies. The following analysis techniques, applied in this case study, have been adapted or extended by consolidated and largely tested SNA techniques, and re-studied specifically to be applied to the organisational context.
Demand (and supply) analysis
The netwo
rk diagram shown in figure 4 identifies the connections between roles by directional arrows. If role A is pointing to role B it means that someone in role A has nominated someone in role B as a “critical” connection for him/her. From a supply and demand point of view we could interpret this context as role A as demander and role B as supplier. In this sense, the roles that have many recurrences (called “in-degrees”) are high in demand. The following table shows which of the 44 business units were most in demand by the observed network.
The business units most in demand can be easily represented as bottlenecks. In fact, a simple efficiency measure of a company could be calculated and guessed simply based on how much the work is spread out within the organisation.
Criticality analysis
Networks placed where there are concentrations of demand on only a few nodes suggest the presence of critical units that are potentially at risk of becoming bottlenecks in the organisation. We can measure and carry out benchmarks of these bottlenecks by making an estimate of criticalities (figure 5):

We can notice how 27% of activities correspond to 50% of connections. Although we would not expect all activities to be equally in demand, this diagram provides us with a scale of the organisation’s robustness. For example, if we found a business in which the main activities (10%) represented 50% of the connections, we would have to deduce that the organisation in question was much more vulnerable (from the point of view of achieving inferior performance) than the company that we examined in our case study.
Value Sources and Value Sinks
When we look at a map of an organisation from the point of view of supply and demand of value, it is possible to understand how various roles and the activities they perform relate to each other by identifying the roles from which there is higher demand for help and those which supply more help. If a correct mapping is carried out, it is also possible to identify the balance of the company by identifying the Value Sources (those in demand) and the Value Sinks (those who demand).
Figure 6 shows a map highlighting the connections between nodes of the same network in relation to supply and demand. In this case the colours identify the Value Sources or the Value Sinks. The size of the nodes depends on the number of connections and the thickness of the linking lines identifies the strength of dependence. Value Sinks are roles that tend to demand more than they supply, whilst the opposite can be said of Value Sources.
What should we try to deduce from this analysis? On a first, more superficial, level, we can note that Value Sinks are negative because they drain energy and demand more than they supply, so they require constant work. On a second level, we can understand how even Value Sources, if too strong, can be negative. This is because the widened size of one of the nodes shows a lack of capability to respond effectively and efficiently to the organisation network. And perhaps a lack of capability could be due to a lack of desire to draw knowledge from other sources.
In this case study, showing the analysis results to individuals in charge of the organisation caused a considerable amount of discussion, also due to the fact that an ONA had been conducted for the first time. We highlighted for the executive committee the example of the change management unit as a Value Sink, which appeared as a node able to absorb large resources compared to the amount it supplies. The CIO informed us that the unit had been broken up just a few days before, suggesting that the analysis conducted was valid.

New visions and future implications
We have already underlined our belief that ONA can be a useful method able to provide a detailed business process analysis without wasting excessive resources, especially compared to BPM and Value Network Analysis.
The analysis of Value Sources and Value Sinks allowed us to immediately identify the areas requiring a more detailed analysis or a greater amount of attention than others. When we identify some business units as Value Sources or Value Sinks, we can ask ourselves why our business has assumed this organisational dimension. For example, we can review the competency level of the individual units that have been identified as Value Sources or Value Sinks.
Figure 7 suggests some possible improvement interventions for the Value Sink/Value Sources issue. A low competency Value Sink can be explained in light of a new position, of a new hire or in any case of any skill-set being formed and that is still gaining the correct competencies to interact with the other roles. The action to take could therefore be to support the role (in terms of time and competencies) in an attempt to make it become more efficient. If the Value Sink is instead highly competent, it is possible that it is not so visible – or accessible – within the organisation and a possible solution could be to promote its role or review the network configuration. In other cases, such as the Change Management Business Unit of our case study, we could consider breaking up and reassigning that role to other roles.
As regards Value Sources with low competency, their roles should be trained and helped to access different roles, so that they can improve their own competency and grow. If the Value Sources are already competent it is therefore possible that their existing resources are insufficient and the demand cannot be efficiently met.
The ONA results can also be usefully used to focus on the processes and activities carried out by Value Networks. A specific focus on the interaction with a good number of Value Sources and Sinks is likely to provide the best return when applied to these complementary analytical techniques.

Conclusions
We have presented Organisational Network Analysis as a technique to review the approach to Business Process Mapping and more focused on the personal and organizational dimension.
We have called these new business models Value Shop and Value Networks, which are much more dependent on the optimisation of the processes within them, on the general improvement of competencies and on the certainty that information and knowledge are truly shared within the whole organisation. In cases like these, simply mapping the work processes prevents us from grasping the real essence and concrete configuration of the business.
We have distinguished ONA from SNA suggesting that, by maintaining the focus on the role, rather than on the personal level, organisations were freer to operate without running into legal constraints caused by the management of employees’ privacy. The case study was used to show how a simple application – on a limited sample – of ONA is able to provide useful information for interpreting the organisational context and the functioning of processes at multiple levels of association. Through a simple analysis of Value Sinks and Value Sources, businesses can easily identify internal problems and take quick action in ord
er to curb them. Alternatively, it provides a valid starting point that can be crossed with other analyses already experimented with, such as Value Network Analysis and Business Process Mapping.
Originally posted on Social Business Manifesto – An Harvard Business Review Italia publication. Written by Laurence Lock Lee and Rosario Sica – http://socialbusinessmanifesto.com/